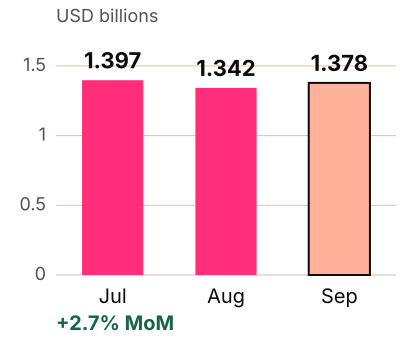
$53.1mSeptember originations per day +4.7% MoM, versus August's $50.7m
1.49 UMIOctober 5 reading, versus 1.50 on September 3
Q2 financialsLatest reported revenue and profit; Q3 results are still pending
The small UMI improvement supports stabilisation, not a clean credit cycle. UMI is Upstart's own model-specific measure of incremental default risk: 1.49 is not a 49% default rate. Upstart September originations and October UMI.
View the origination data
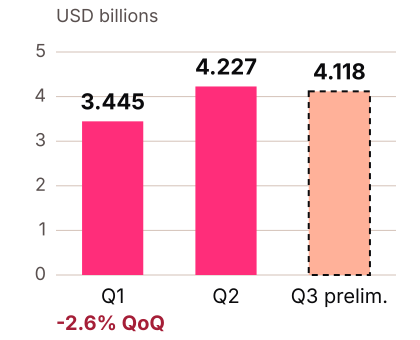
Originations: reported and preliminary
Period
Originations, $m
Basis
Q1 2026
3,445.1
reported; derived from first-half less Q2
Q2 2026
4,227.2
reported
Q3 2026
4,117.8
preliminary monthly sum
July 2026
1,397.4
preliminary
August 2026
1,342.1
preliminary
September 2026
1,378.3
preliminary
02 / Earnings quality
Profitable again. Cash conversion still matters.
Q2 revenue reached $364.7m and GAAP net income $16.5m. Adjusted EBITDA was $76.9m, but that headline omits meaningful shareholder costs.
Valuation implication. The model charges the economic cost of recurring stock compensation before owner cash. It also retains capital for growth and normal credit losses. Adjusted EBITDA is not treated as cash available to equity holders.
03 / Operating leverage
Revenue outpaced costs.
Q2 operating income turned positive: +$14.64m, up from −$7.52m in Q1.
Reported margins: different denominators and economic meanings
Measure
Q2 2025 as reported
Q1 2026
Q2 2026
Total revenue, $m
257.29
308.21
364.71
Operating cost, $m
252.75
315.73
350.07
Operating income, $m
+4.54
−7.52
+14.64
Operating income / total revenue
1.77%
-2.44%
4.01%
Contribution profit / fee revenue
58.37%
49.55%
55.49%
Adjusted EBITDA / total revenue
20.62%
13.13%
21.09%
Operating-leverage comparison: annual growth is not normalized
Calculation
Q2 2026 QoQ
Q2 2026 YoY as reported
Revenue growth
+18.33%
+41.75%
Operating-cost growth
+10.88%
+38.50%
Revenue less cost growth
+7.45 pp
+3.24 pp
Incremental operating margin
39.22%
9.40%
Contribution margin change
+5.95 pp
−2.88 pp
Contribution margin uses fee revenue; adjusted EBITDA and the operating margin above use total revenue. Upstart’s fee-based operating margin is 4.21%, so it differs from the 4.01% total-revenue ratio. Contribution profit and adjusted EBITDA are company non-GAAP measures. Sources: Upstart Q2 2026 earnings release; Upstart amended Q2 2026 Form 10-Q.
Why this supports the growth case. Profitable operations create more scope to invest in acquisition and product development. The 39.22% incremental margin spans a loss-to-profit quarter; it does not establish the model’s mature 14% owner-cash margin. Contribution margin recovered to 55.49% from Q1’s 49.55%, below the prior-year 58.37%. The conditional $38 estimate still depends on cash after economic stock pay, credit-asset funding, retained equity, capex and debt.
Calculation and comparability
Q1 is first-half less Q2; both 2026 quarters use the same presentation. Operating cost = total revenue − GAAP operating income. Growth spread = revenue growth − operating-cost growth, in percentage points. Incremental margin = change in operating income / change in revenue. Neither is a degree-of-operating-leverage multiple: that multiple is unstable across a loss-to-profit transition.
In 2026, convertible-note expense and income on certain cash accounts moved into the net interest and fair-value revenue line. The prior year was not reclassified. YoY revenue and operating-income comparisons are therefore as reported; net income and cash flow were unaffected by this presentation change. Sources: Upstart amended Q2 2026 Form 10-Q.
A seasonally adjusted comparison would require 14 consistently defined quarters. A fully reconciled series is not established for this edition; the quarterly recovery above is not claimed to be seasonally adjusted.
How reinvestment changes the outcome
Using Q2’s expense mix, this illustration holds revenue growth and other operating-cost growth at +35%, then varies SG&A growth. SG&A means sales and marketing plus general, administrative and other expenses: $194.89m. Other operating costs were $155.18m. Sources: Upstart amended Q2 2026 Form 10-Q.
Analyst illustration: revenue and other operating costs each grow 35%
SG&A growth
Operating income, $m
Operating margin
+25%
+39.25
7.97%
+35%
+19.76
4.01%
+45%
+0.27
0.06%
Income = $364.708m × 1.35 − $194.890m × (1 + SG&A growth) − $155.179m × 1.35. These are hypothetical quarterly operating outcomes, not issuer guidance, owner cash or the valuation forecast. Borrower acquisition is counted once within operating expenses; contribution costs are not deducted again. Spending alone does not establish a growth response. Tax, retained capital and credit funding still affect cash available to owners.
04 / The macro backdrop
A mixed backdrop. Pressure and possible support.
Policy tightening and weak hiring make near-term lending harder. Cooling core CPI, resilient spending and steadier credit transitions offer some support. None guarantees lower losses or cheaper funding.
Headwind / Interest rates
3.75–4.00% Fed target
The Fed raised its target by 25 basis points on September 16. Higher loan yields and funding costs can reduce affordable approvals; higher loan yields can also attract buyers when risk-adjusted returns are attractive. Fixed-rate convertibles do not all reprice with the next Fed move.
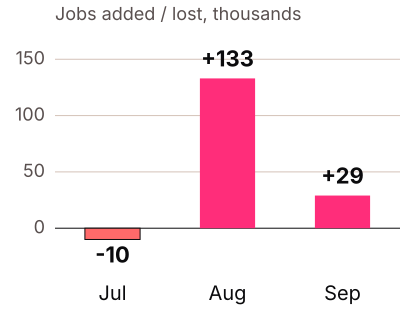
Unemployment was 4.2%. July payrolls were revised to −10,000 and August to +133,000. Weak hiring can raise borrower risk and make capital providers more selective, even when demand for refinancing remains high.
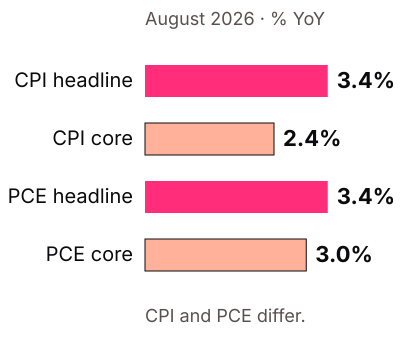
August core CPI eased from July's 2.5%, but both headline CPI and PCE were 3.4% YoY. Some disinflation could eventually help policy and household budgets; PCE still argues against assuming rapid easing. CPI and PCE measure different baskets.
August real disposable income was flat and the saving rate was 4.1%. Spending resilience can support loan demand, while limited income growth leaves borrowers exposed. Debt consolidation demand only creates value if the loan is priced and funded profitably.
The New York Fed's Q2 data put 4.7% of debt in some stage of delinquency. Card transitions into early delinquency were broadly steady; auto transitions rose slightly. Transitions remain elevated. Stability helps the funding case, but this economy-wide, lagged dataset is not Upstart's borrower cohort.
Upstart's October risk reading edged down. This gives a more direct check on its underwriting environment, but a one-month move is too small to establish a durable improvement. The broader macro indicators and UMI should be read together.
How this enters the valuation. The central case assumes no automatic rate cuts, no material net equity funding shortfall, and normal losses within cash margins. Stronger funding conditions could lift value; persistent job weakness or higher investor return requirements could push it below the working range.
05 / Revenue outlook
A longer runway. A more gradual growth fade.
The revised base starts with the $1.4bn 2026 guide and reaches $2.57bn in 2028, matching management’s reaffirmed 35% revenue CAGR target for 2025–2028. Growth then moderates, reaching $7.72bn in 2036. That later path is our assumption.
The 2028 endpoint is derived from 2025 reported revenue × 1.35³; management guides the CAGR, not this exact dollar amount. The dashed line retains the earlier slower-growth case. Subsequent growth is an analyst forecast. Sources: Upstart Q4 and full-year 2025 results; Upstart Q2 2026 earnings presentation.
Market footprint: room to keep gaining share.
The base case fades unsecured fee growth gradually to 30%, 25%, 20%, 15% and 10% in 2029–2033. Low current penetration and expanding products support a longer runway; they do not establish those annual rates. These are analyst assumptions, with a 14.5% required return and owner cash rising from 2% to 14%.
Market footprint: distinguish loan counts, annual flows and credit limits
Market measure
Observed footprint
Scope
Personal loans · Q1 2026
~6.4% indicative count benchmark
Same quarter; product scopes may differ.
Auto loans · 2025
$715.2bn annual originations
New principal; excludes leases.
HELOCs · 2025
$198.3bn annual new limits
Committed credit limits, rather than draws.
Upstart auto + HELOC
0.258% indicative benchmark
Q2 2026 × 4 / 2025 combined flows; periods differ.
The count benchmark uses 410,854 Upstart unsecured originations / 6.4m industry personal loans. It is not a certified market share. Upstart’s unsecured definition includes small-dollar loans and now Cash Line draws; exact Q1 draw exclusion is unverified. Counts differ from dollar flow. Secured flow is annualized Q2 × 4 = $2.35bn, compared with 2025 markets; it is not actual annual share. Sources: Upstart Q1 results · TransUnion personal-loan report · Upstart Q2 results · Equifax originations report.
The broad markets are not fully serviceable: Upstart sunset auto refinancing in Q2, while distribution and eligibility also limit reach. Upstart Q2 presentation.
Unit economics: scale must earn its way.
Unsecured acquisition cost per counted loan rose about +1.3% YoY, versus +12.1% YoY across the platform as the product mix changed. Unsecured fee revenue per loan changed −5.7% YoY, while contribution margin was 61.5%. Secured contribution margin remained −35.2%. More volume can fund reinvestment, provided core economics hold and secured products become profitable. These quarterly ratios do not establish customer lifetime value or the return on the next marketing dollar. Upstart Q2 Form 10-Q.
Pricing and competition: better offers must preserve returns.
SoFi originated $10.7bn of personal loans in Q2, +54% YoY; deposits cost 156 basis points less than warehouse funding, and existing members opened 51% of its new products. Happen, formerly LendingClub, originated $3.145bn across its loans, +29% YoY, with bank funding and marketing expense of 1.99% of originations. Those funding and distribution advantages matter; the different business models prevent a simple margin ranking. SoFi Q2 results · Happen Q2 results.
Upstart says its HELOCs can close in six days, with average rates over 200 basis points below competitors and a −15% QoQ change in origination cost. Those are management claims. Lower rates and a smoother process can expand demand, but no causal price elasticity is disclosed; lending partners must still earn adequate returns. Upstart Q2 prepared remarks.
Market assumptions and what a price cut must earn back
At unchanged Q2 total-fee-to-flow ratios of 8.97% for unsecured and 3.69% for secured, the base’s 2036 fees would imply about $72.4bn unsecured and $30.4bn secured annual flow. This is a scale illustration: the ratios include servicing and loan-sale fees, and future mix, fee pricing and loan-book seasoning can change them. Loan flow is not Upstart balance-sheet lending.
The dated personal-loan benchmark is $155bn of annual originations in Q3 2023–Q2 2024. If that market grows at an assumed 3–6% annually from 2024, implied 2036 penetration is roughly 23%–33%. That requires substantial durable share gains; neither the market-growth assumption nor the future share is reported evidence. The current $281bn industry loan balance is a stock, so it is not substituted for annual originations. The older Home market figure covered all mortgages; first mortgages and small business are excluded from this current-product assessment. Upstart 2024 annual report · TransUnion personal-loan report.
Illustrative pricing break-even; constant loan mix and other direct unit costs
Fee revenue per loan cut
Acquisition cost per loan
More loans to preserve contribution
5%
+0%
+8.8%
10%
+0%
+19.4%
5%
+10%
+14.1%
Starting with Q2 unsecured fees of $326.301m, contribution profit of $200.768m and acquisition costs of $84.712m, break-even volume factor = contribution profit / (contribution profit − lost fee revenue − extra acquisition cost). This hypothetical keeps borrower verification and servicing cost per loan constant. A fee cut is not an APR cut: borrower pricing also reflects expected losses, funding costs and lender returns. No demand response is assumed. Upstart Q2 Form 10-Q.
Contribution profit already deducts acquisition, verification and servicing costs. They are not deducted again from the valuation’s normalized net-profit bridge. The gradual fade depends on repeat and cross-sell demand, stable core unit costs, competitive fees, partner funding and eventual secured profitability. Growth can weaken before market saturation if any of those conditions fail. Upstart 2025 Form 10-K.
What the base case needs
Analyst product assumptions
Revenue line
2027 growth
2028 growth
Later years
Unsecured fees
36.0%
36.0%
Slows to 10% by 2033
Secured fees
65%
60%
Slows to 20% by 2033
Net interest / fair value
0%
0%
Flat through 2033
2026 fees are allocated using Q2 product mix, an estimate. All three lines fade separately to 3% growth over 2034–2036. Product growth rates, secured profitability and cash margins are analyst assumptions.
Faster growth can be worth more—even while reinvesting.
Q2 revenue grew about 42% YoY and fee revenue about 45%. Sales and marketing spending was already up about 57%. Profitability creates more room to invest, but a dollar spent on acquisition or product development is not also cash available to shareholders. The revised central case sustains growth for longer and retains more cash early: the starting owner-cash margin falls from 4% to 2%. Sources: Upstart Q2 2026 earnings release; Upstart Q2 2026 earnings presentation.
Growth and reinvestment: compare the assumptions together
Analyst case
2028 revenue, $bn
Owner-cash margin
Equity return
Value/share
Earlier cautious case
2.16
4% → 14%
14.5%
$27.72
Shorter growth runway
2.57
2% → 14%
14.5%
$30.72
Revised central case
2.57
2% → 14%
14.5%
$38.42
The earlier case assumed roughly 24% total growth in 2027–2028 and did not reach the reaffirmed target. The revised central case implies about 35% annual growth through 2028, then tapers unsecured growth to 30%, 25%, 20%, 15% and 10% over 2029–2033. The shorter-runway comparison instead uses 20%, 16%, 13%, 10% and 8%. Both use the same 2%–14% cash-margin path, 14.5% required return, share count and 3% terminal growth. Growth after 2028 is our judgment; the company has not guided to those annual paths.
What if faster growth converts less cash?
Reducing the mature owner-cash margin to 12%, with the same 2% starting margin and 14.5% return, gives $26.58 for the shorter runway and $33.21 for the revised central growth path. This isolates cash conversion from growth duration. Management’s 25% adjusted EBITDA margin target for 2028 is a different measure; it does not establish a 25% owner-cash margin. Sources: Upstart Q2 2026 earnings presentation.
Why not fade both products evenly until 2036?
Fading each product’s 2028 growth rate linearly to 3% in 2036 raises value to $45.90, with the same required return and owner-cash margins. It implies $9.49bn of 2036 revenue. This is a more demanding duration sensitivity. Market size alone does not establish that funding, distribution, pricing and credit economics can support that path.
The $30–46 working range is a judgment across selected growth and cash-conversion assumptions. It is not a floor, a statistical interval or the full range of plausible outcomes.
The forecast already requires meaningful execution. Secured growth starts from a small base; no standalone value is assigned to bank execution. The next earnings release needs to show that volume growth can translate into better margins and manageable capital demands.
06 / Fair value
About $38. More growth, with reinvestment.
The calculated base value is $38.42 per share. The rounded $38 central estimate implies about 58% upside from the $24.02 close. Confidence remains low-to-moderate.
Scenario values are analyst estimates. The dashed line shows the October 7 close. These are not price targets with a specified realization date.
Scenario assumptions
Scenario
Value/share
Equity return
Mature cash margin
Weight
Bear
$7.04
17.0%
8%
30%
Base
$38.42
14.5%
14%
55%
Bull
$74.37
12.5%
18%
15%
The subjective weighted mean is $34.40. The central case is the headline because the bull outcome requires much stronger execution. The $30–46 working range expresses analyst judgment around that case; it is not the full scenario range or a statistical confidence interval. The bear scenario is not a floor.
Base equity cash-flow model. Terminal growth is 3%; required equity return is 14.5%. Values are calculated as of October 7, 2026.
With 57.5% of the base value beyond 2036, small changes in long-term cash margins and required returns matter more than a precise near-term revenue estimate.
07 / What changes the answer
Valuation uncertainty is larger than the apparent discount.
Holding revenue growth constant, tougher return and cash-margin assumptions reduce value to about $26. Improved conditions lift it to about $57. These illustrations are not forecasts of a particular economic outcome.
Tougher: 16.5% required return, 12% mature cash margin. Central: 14.5%, 14%. Improved: 12.5%, 16%. These are joint sensitivities, not direct estimates of the effect of a Fed decision.Base product-growth forecast and starting 2% cash margin stay fixed. Mature margins change the entire linear cash-margin path.Read all nine valuation sensitivities
Base-growth valuation sensitivities, USD per share
Equity return
12% cash margin
14% cash margin
16% cash margin
12.5%
$43.61
$50.53
$57.45
14.5%
$33.21
$38.42
$43.63
16.5%
$26.17
$30.23
$34.29
What would improve conviction
Profitable loan growth, sustained improvement in UMI and loss vintages, stronger secured contribution margins, and reliable funding without excessive retained equity.
What would weaken the estimate
Rising losses, reduced loan-buyer demand, repeated guidance misses, or bank and debt funding requirements that consume earnings or dilute existing holders.
Additional capital and dilution sensitivities
An extra 1% annual residual dilution, including after 2036, reduces base value to $33.37. An immediate $500m net capital shortfall reduces it to $33.86. Each is a separate stress, not a reported requirement, and is not added to the macro chart.
As an arithmetic illustration only, a fully floating $251.8m warehouse balance repriced by 25 basis points would add roughly $0.63m annual interest before offsets. Actual resets, hedges, balances and pass-through differ. The larger macro exposure is pricing, loan performance and funding availability. Upstart amended Q2 2026 Form 10-Q.
08 / Technical context
Early momentum repair. The downtrend still dominates.
The $24.02 close sits below the 20-, 50- and 200-session averages. RSI remains below 50. A positive MACD histogram shows improvement, while the trend and volume provide limited confirmation.
UPST · daily close and moving averages · USD
Close $24.02
SMA20 $24.41
SMA50 $27.27
SMA200 $31.92
One-year close return −53.64% · history through 7 October 2026
Completed daily sessions, 7 October 2025–7 October 2026. Averages and recursive indicators are calculated from the full 1,458-session history. Source: UPST completed-session daily prices and volume.
Daily trend: 20, 50 and 200 completed sessions
Average
7 October value
Close versus average
SMA20
$24.41
−1.62%
SMA50
$27.27
−11.92%
SMA200
$31.92
−24.75%
−53.64%One-year close-to-close return 7 October 2025–7 October 2026
$22.56–55.22One-year daily low-to-high range distinct from closing-price return
1.052×Mean volume: latest 10 sessions divided by preceding 30 sessions
RSI · recent strength
Latest 41.92 · 14 sessions
RSI compares recent price rises and falls using Wilder smoothing over 14 sessions. Below 50 indicates recent weakness; it is not a valuation measure.
MACD · changing momentum
−1.126 / −1.262 · histogram +0.137
MACD
Signal
MACD = EMA12 − EMA26; signal = EMA9 of MACD. The positive histogram shows early improvement, while both lines remain below zero.
Price levels · past turning points
Dashed line: 7 October close $24.02
Last 756 daily sessions; five closes on each side of a confirmed pivot, 2.5% clustering and at least two pivot touches. Approximate zones, not guaranteed floors or ceilings.
Momentum and volume readings
Indicator
7 October reading
Interpretation
Wilder RSI14
41.92
Below 50; above the conventional 30 threshold
MACD12/26
-1.126
Still below zero
Signal EMA9
-1.262
Still below zero
MACD histogram
+0.137
MACD above signal; early improvement
10-session / prior 30-session mean volume
1.052×
Activity is near the comparison baseline
Qualified support and resistance: approximate closing-pivot clusters
Rank
Zone
Price
Pivot touches
Versus close
S1
Support
$23.38
6
−2.67%
S2
Support
$21.88
3
−8.91%
R1
Resistance
$24.29
3
+1.12%
R2
Resistance
$25.91
3
+7.87%
Entry context. Sustained closes above the nearby $24.29 zone and the $24.41 20-session average would improve the short-term picture; $25.91 and the $27.27 50-session average are later tests. A failure around $23.38 would weaken it. Those zones can fail and do not establish a trading probability. Positive MACD alone does not confirm a durable reversal.
Three lenses, one assessment
Valuation compared with operating and market evidence
Lens
Current evidence
Implication
Fundamental value
$38.42 calculated / $38 central
Conditional on growth, cash margins, retained capital and refinancing; $30–46 is a judgment range.
Operating leverage
+7.45 pp QoQ spread / 39.22% incremental margin
Supports profitable growth; does not validate sustained 14% owner cash.
Technicals
Below SMA20/50/200; improving MACD histogram
Cautious entry context. Does not mechanically change fair value.
Technical calculation and limits
Simple averages use the latest 20, 50 or 200 completed closes. Wilder RSI seeds with 14 price changes; EMA12 and EMA26 seed with their first full windows, and the signal is EMA9 of available MACD values. Full IPO history starts on 16 December 2020. Price zones use 756 sessions; the latest five sessions cannot yet qualify as confirmed pivots.
Daily history has no explicit adjustment flag, so no separate adjustment is assumed. Volume describes aggregate activity, not buyer identity. Technical indicators summarize historical prices; they are not price forecasts. The $38 fundamental estimate has no fixed realization date.
09 / The calculation
Value the cash that can reach owners.
The model discounts ten years of owner cash from 2027–2036 and a continuing value. Cash is after the economic cost of stock pay, taxes, corporate interest, normal credit losses, capex and retained equity funding.
The base owner-cash margin rises smoothly from 2% to 14%. Illustratively, a 6% normalized net margin less 4% retained capital gives 2% owner cash in 2027; 18% less 4% gives 14% in 2036. Sales, marketing and product spending are already expenses within the assumed net margin; retained capital is a separate deduction. These margins are assumptions, not reported cash-flow measures.
The denominator is Q2's 109.72m diluted weighted-average shares, a conservative proxy rather than an October cap table. Recurring compensation is charged through cash margins; extra ongoing dilution for the same compensation is not also charged.
This is an equity cash model. It adds no cash, loan assets or restricted balances and subtracts no net debt separately. It assumes refinancing or asset-funded repayment, with retained capital embedded in margins. Upstart amended Q2 2026 Form 10-Q.
Reproducible base forecast: analyst assumptions
Year
Revenue $m
YoY growth
Cash margin
Owner cash $m
PV/share $
2027
1,891
+35.1%
2.0%
38
0.29
2028
2,568
+35.8%
3.3%
86
0.58
2029
3,352
+30.5%
4.7%
156
0.92
2030
4,213
+25.7%
6.0%
253
1.30
2031
5,080
+20.6%
7.3%
373
1.67
2032
5,886
+15.9%
8.7%
510
2.00
2033
6,537
+11.1%
10.0%
654
2.24
2034
7,090
+8.5%
11.3%
804
2.40
2035
7,499
+5.8%
12.7%
950
2.48
2036
7,724
+3.0%
14.0%
1,081
2.47
Discount dates are each December 31, using actual days from October 7 divided by 365.25. Base required return: 14.5%; terminal growth: 3%. No distributable cash is credited for the remaining 2026 period. Owner cash equals revenue × cash margin. Value equals discounted owner cash per share plus discounted terminal cash per share.
Balance-sheet treatment and model limitations
June principal included $251.8m warehouse financing, $92.0m risk-retention financing and $1.688bn convertibles. Convertibles remain corporate obligations. The historical diluted-share proxy includes some conversion shares; no separate conversion benefit is credited. Restricted cash is not treated as excess cash.
Cash margins simplify the operating expense, credit-asset, debt and bank-capital schedules. They do not reconstruct GAAP cash flow or establish that refinancing will be available. A full debt-maturity and capital model could materially change the estimate. Additional financing can reduce value below the bear scenario. Upstart amended Q2 2026 Form 10-Q.
SlopStreet / Upstart explained / 7 October 2026
Upstart. In plain English.
It helps people get loans. It is growing and making a profit again. The big question: can it keep growing and leave more money for its owners?
Our estimate of a share’s valueA reasoned estimate, not a promise
The share price was $24.02 at the 7 October close.
Our working range is $30–46, with low-to-moderate confidence: important parts still need proof. A much weaker outcome is about $7. You could lose money.
Same research as WallStreet, explained step by step. Prices and evidence stop at 7 October 2026. Figures are in US dollars. This page does not update live.
01 / Start here
What does Upstart actually do?
Imagine you want a loan for a car or to replace several expensive debts with one payment. A lender needs to decide whether you can pay it back.
Upstart supplies software that helps lenders make that decision. It uses information about the borrower to estimate the chance of repayment. It also helps people apply and helps arrange the loan.
It earns fees when loans are arranged and managed. Much of the loan money comes from banks and other investors. Upstart also holds some loans itself, which adds risk.
A person appliesThey want to borrow money.
A lender decidesUpstart’s software helps assess the application.
A loan is fundedUpstart can earn fees. The borrower must still repay.
Where does a share fit in?
A share is a small piece of ownership in a business. Its price is what buyers and sellers agree to pay today. Its value depends partly on how much money the business could leave for its owners in future. Those two numbers can differ.
Why this matters: Upstart needs both people who want loans and people willing to fund them. More applications alone are not enough.
02 / What has improved?
More sales. A profit again.
From April to June 2026, Upstart reported $364.7 million of revenue. Revenue is what the business earns before its costs. It differs from cash received. As reported, that was 41.75% more than the same three months a year earlier. The accounting presentation changed between those years, so this is not a perfectly matching comparison.
After its expenses, it reported $16.5 million of net profit. That is encouraging. But one profitable quarter does not prove it will stay profitable.
Reported result · April–June 2026
For every $100 of company revenue…
Most was used up. About $4.50 remained as net profit.
$95.50Net costs, taxes and other items
$4.50Net profit
Rounded from the quarter’s reported results. This is company revenue, not your investment or a loan amount. Net profit is not the same as cash owners can take out.
Think of a busy café.
A café still pays rent whether it sells 100 drinks or 150. If sales grow faster than costs, more of each extra sale can turn into profit. That is the idea behind operating leverage.
Reported comparison · Q2 versus Q1 2026
Sales grew faster than costs.
Revenue growth+18.33% QoQ
Operating-cost growth+10.88% QoQ
0% growth20% growth
Revenue grew 7.45 percentage points faster.
Both bars use the same scale. Costs still rose; they simply rose more slowly than revenue.
“QoQ” means one quarter compared with the previous quarter. Upstart’s revenue grew faster than its operating costs.
More detail on the cost improvement
Its operating result moved from a $7.52 million loss to a $14.64 million profit.
For every extra $100 of revenue in that comparison, about $39 became extra operating profit. That is a useful sign, not a rule for every future $100.
Why profit is not the same as money owners can take out
Think of running a small shop. You may make a profit, then need money for equipment, stock or the next month’s bills. Upstart also needs money to keep growing and fund parts of its lending business.
Our valuation estimates what could remain after those needs. The company also reports “adjusted EBITDA” of $76.9 million. That measure leaves out some costs. It is not the same as the $16.5 million net profit or money available to owners.
Our view: The recovery is real in these results. We still need proof that it can keep more money while growing.
03 / How much room is left?
A big market gives it room. It still has to win customers.
Upstart is small compared with the wider US lending market. That gives it space to expand without needing to dominate the whole market. It is also building loans linked to cars and homes.
We therefore allow fast growth to continue before slowing gradually. Our forecast assumes revenue grows about 35% in 2027 and 36% in 2028, then about 31% in 2029. These are our assumptions, not results already achieved.
2027
+35.1% YoY
2029
+30.5% YoY
2031
+20.6% YoY
2033
+11.1% YoY
2036
+3.0% YoY
Selected years from our forecast. “YoY” means compared with the previous year. Each signed percentage shows revenue growth. The bars show growth rates, not revenue totals.
Why slow growth down at all?
If a shop adds 10 customers to its first 20, it grows by 50%. Add 10 to 200 and it grows by 5%. A larger business needs many more new customers to keep the same growth rate. Competition and the economy can make that harder.
Could reinvesting profit make it grow faster?
Yes. Spending on staff, advertising and better products could bring in more customers. But spending more is useful only if those customers leave enough money after costs. Being profitable does not make every extra dollar spent a good investment.
Personal loans currently earn more in fees than they cost to deliver. The newer car and home-backed products, taken together, cost more to deliver than they earn in fees. Upstart needs those products to make money per loan, as well as grow.
How loan prices and competition affect growth
Why cheaper loans could help
Think about a phone contract: a lower monthly bill may persuade more people to sign up. A cheaper loan can work the same way. Economists call the response to a price change elasticity of demand.
We do not have reliable evidence saying that a particular price cut would produce a particular increase in Upstart loans. Lower prices can attract customers, but can also leave less money per loan. The interest a borrower pays and the fees Upstart earns are different things; a cut in one does not automatically mean a cut in the other.
SoFi and Happen, formerly LendingClub, are growing too. Banks that can use customer deposits may have cheaper funding than companies relying on other lenders. A large market does not remove that advantage.
What would strengthen our view: More loans, a sensible cost to attract each customer, and newer products leaving money after their direct costs.
04 / The world outside Upstart
Loan costs and jobs can change the story.
Higher interest rates make borrowing harder.
Interest is the price of borrowing money. In September, the US central bank raised its main rate to 3.75–4.00%. That can raise funding costs and make monthly loan payments less appealing. Our forecast does not assume automatic rate cuts.
Jobs help people repay.
The US added only 29,000 jobs in September, with unemployment at 4.2%. A weaker jobs market could leave more borrowers struggling to pay. Lenders may then approve fewer loans or ask for higher interest.
People are still spending, but budgets are stretched.
Household spending rose in August after allowing for higher prices, while take-home income after inflation was flat. Inflation means things cost more. If everyday bills squeeze a household’s budget, a loan can be harder to repay.
What could help
Affordable loans, steady jobs and investors willing to supply funding could allow more good loans to be approved.
What could hurt
Expensive funding, lost jobs or more missed payments could reduce approvals and profits.
Why we care: Better software cannot make an unaffordable payment affordable for everyone.
05 / A useful reality check
The latest loan numbers are mixed.
Preliminary figures show Upstart arranged $4.118 billion of loans in July–September. That is 2.6% less than April–June. September improved from August, but the full quarter was still lower.
Loan amounts and Upstart’s revenue are different things. If it helps arrange a $10,000 loan, it does not keep the full $10,000 as revenue. Its fees are only part of the loan amount.
Upstart’s measure of the outside credit environment also improved slightly, from 1.50 to 1.49. It is an index, like a gauge on a dashboard. It does not mean 49% of borrowers failed to pay.
Our view: The annual recovery remains encouraging, but the latest quarter does not justify assuming growth will speed up in a straight line.
06 / Why we estimate $38
A price today. An estimate about the future.
The share closed at $24.02 on 7 October. Our central estimate is $38 a share. The calculation gives $38.42; we round it because the future is much less precise than a calculator.
That puts our $38 estimate 58.2% above that day’s price. It does not mean the share will rise by 58.2%, or tell us when it might reach $38.
How we work out the estimate, in five steps
Estimate how large the business could become. We forecast its revenue for ten years.
Estimate what could remain for owners. We allow for running costs, taxes, interest, stock-based staff pay and money needed to keep the business going.
Give future money less weight than money today. Waiting carries risk. We use a 14.5% annual required return to reflect that risk.
Allow for the business continuing after ten years. We assume slower growth of 3% a year after that.
Divide the estimated value among the shares. We use the April–June average of about 109.72 million diluted shares, allowing for certain potential extra shares. It is an estimate of the share count, not an exact October count.
The assumption doing a lot of work
In our middle case, money left for owners rises from $2 per $100 of revenue to $14 per $100 by 2036. That is a forecast, not what it keeps today.
Our forecast · not a reported result
What could be left for owners?
Each square stands for $1 of company revenue. Pink squares show the money our model assumes could remain after costs and the business’s funding needs.
2027 assumption$2 out of $100
2 pink squares out of 100
2036 assumption$14 out of $100
14 pink squares out of 100
Different from the reported net-profit graphic above. These are assumptions about future cash, not investor returns or promised dividends.
We also assume Upstart can replace or repay its financing when needed. If it cannot, owners could receive much less. Spending on growth is already included in our assumed costs; we do not treat that spending as free.
More than half the estimate depends on money after the first ten years. That makes the answer very sensitive to assumptions about the distant future.
Why $38: We allow strong growth to fade gradually and expect more money to remain for owners. Both need to happen. A fast-growing business can still be a disappointing investment if costs, funding needs or the purchase price are too high.
Growth and cash left for owners disappoint, or funding stays difficult.
Middle outcome
$38
Growth slows gradually, profits turn into more money for owners, and financing remains available.
Stronger outcome
About $74
The business grows faster and leaves more money for owners than our middle case.
Scenario estimates versus a dated market price
A weaker outcome could be worth much less.
Weaker scenario estimateAbout $7
7 October closing price$24.02
Middle scenario estimate$38
Stronger scenario estimateAbout $74
$0$80 per share
Longer bars mean higher dollar values, not more likely outcomes. The black bar is a past trading price; the other bars are model estimates. None is a guaranteed future price.
Our narrower $30–46 working range covers variations around the middle case. It is not a guaranteed range or a safety net. The price can fall below it, below $7, or the investment could lose all its value.
Why the weighted average differs from $38
We give the weaker, middle and stronger cases weights of 30%, 55% and 15%. These are our judgments, not measured chances. Their weighted average is about $34.40. That is a separate cross-check; $38 is the rounded middle-case estimate.
How to use this: Look at what has to go right and what could go wrong. One attractive estimate is not enough to make an investment suitable for you.
08 / What does the price chart tell us?
The business is improving. The share price is still weak.
The share’s closing price fell 53.64% over the year to 7 October. It also sat below its average price over the last 20, 50 and 200 trading days.
A price chart shows what buyers and sellers have done. It cannot tell us what they will do next, or how much cash the business will produce.
Read the chart with us · evidence through 7 October 2026
Follow the numbered arrows.
These are the real price patterns from our research. Match each arrow to the short explanation below its chart. The averages count trading days: days when the market is open.
Share price and its smoother averages · US dollars
Daily closing price
20-day average
50-day average
200-day average
The black line: the price at the end of each trading day. Arrow 1 points to the last close: $24.02 on 7 October. It is a market price, not proof of what the business is worth.
The smoother lines: a picture of the recent past. Arrow 2 points to the 200-day average, $31.92. The price is below this and the shorter averages. That tells us the recent price pattern is weak. The averages do not predict a future price.
3 / RSI: rises versus falls
Latest 41.92 · a scale from 0 to 100
Has the price risen or fallen more strongly lately? Arrow 3 points to 41.92, below the middle marker of 50. Recent price action is weak. This score does not tell us whether the business is cheap.
4 / MACD: is the pattern changing?
Latest bar +0.137 · lines still below zero
Faster trend minus slower trend
Smoothed comparison
A small sign of improvement. Arrow 4 points to the tiny last bar above zero. The pink line is now above its smoothed comparison, so the last bar is positive. Both lines are still below zero. Think “early hint”, not “recovery proven”.
5 / What do support and resistance mean?
Places where the price has turned before. Arrow 5 points to about $23.38. “S” means support; “R” means resistance. These areas can help describe past trading, but the price can move straight through them. They are not a safety net.
Put the clues together: the price trend is weak; one momentum measure is improving. Neither proves our $38 estimate is right, or tells us what happens next. Price history: 7 October 2025–7 October 2026. RSI/MACD: 126 sessions through 7 October 2026.
What the chart terms mean
Moving average
The average closing price over a recent set of trading days. It smooths out daily ups and downs. The 20-day average was $24.41, above the $24.02 close.
RSI: 41.92
A 0–100 score comparing recent price rises with falls. This reading suggests recent weakness. It does not measure how cheap the business is.
MACD: a small improvement
A comparison of shorter and longer price trends. One part of this measure improved, but the wider trend was still weak. That is an early hint, not proof of a recovery.
Support and resistance
Areas where the price has turned before. Around $23.38 and $24.29 are nearby examples. They are clues from past prices, not a floor and ceiling.
Our view: The business results give reasons for hope. The price chart calls for caution. We use the chart to describe the recent pattern; it does not decide our $38 value estimate.
The next results are scheduled for 3 November 2026. These are the questions we want them to answer:
Are loans growing again? September improved, but the quarter was lower than the previous one.
Are costs rising more slowly than revenue? That would help the business keep more of what it earns.
Are new products becoming worthwhile? More car and home-backed loans should eventually leave money after direct costs.
Are borrowers paying and lenders still funding? Upstart needs both sides to keep working.
Can profit become money available to owners? Growing revenue and an adjusted profit figure alone do not settle this.
Our current view: Upstart has a credible recovery and room to grow. Our $38 estimate allows for that opportunity. We remain cautious because newer products, loan funding and lasting cash for owners still need to prove themselves.
Company and macro claims use the official disclosures below. Market pricing uses completed-session history. Interpretations, growth forecasts, cash margins, required returns, scenario weights and the valuation range are analyst judgments.
UPST completed-session daily prices and volumeM2 · Session 2026-10-07
Data cutoff: 7 October 2026. Financial period: Q2 2026. Preliminary operating period: Q3 2026. Figures are rounded for display; calculations retain full precision.